
Good Data, Bad Data
Everyone has data. Almost nobody has power.


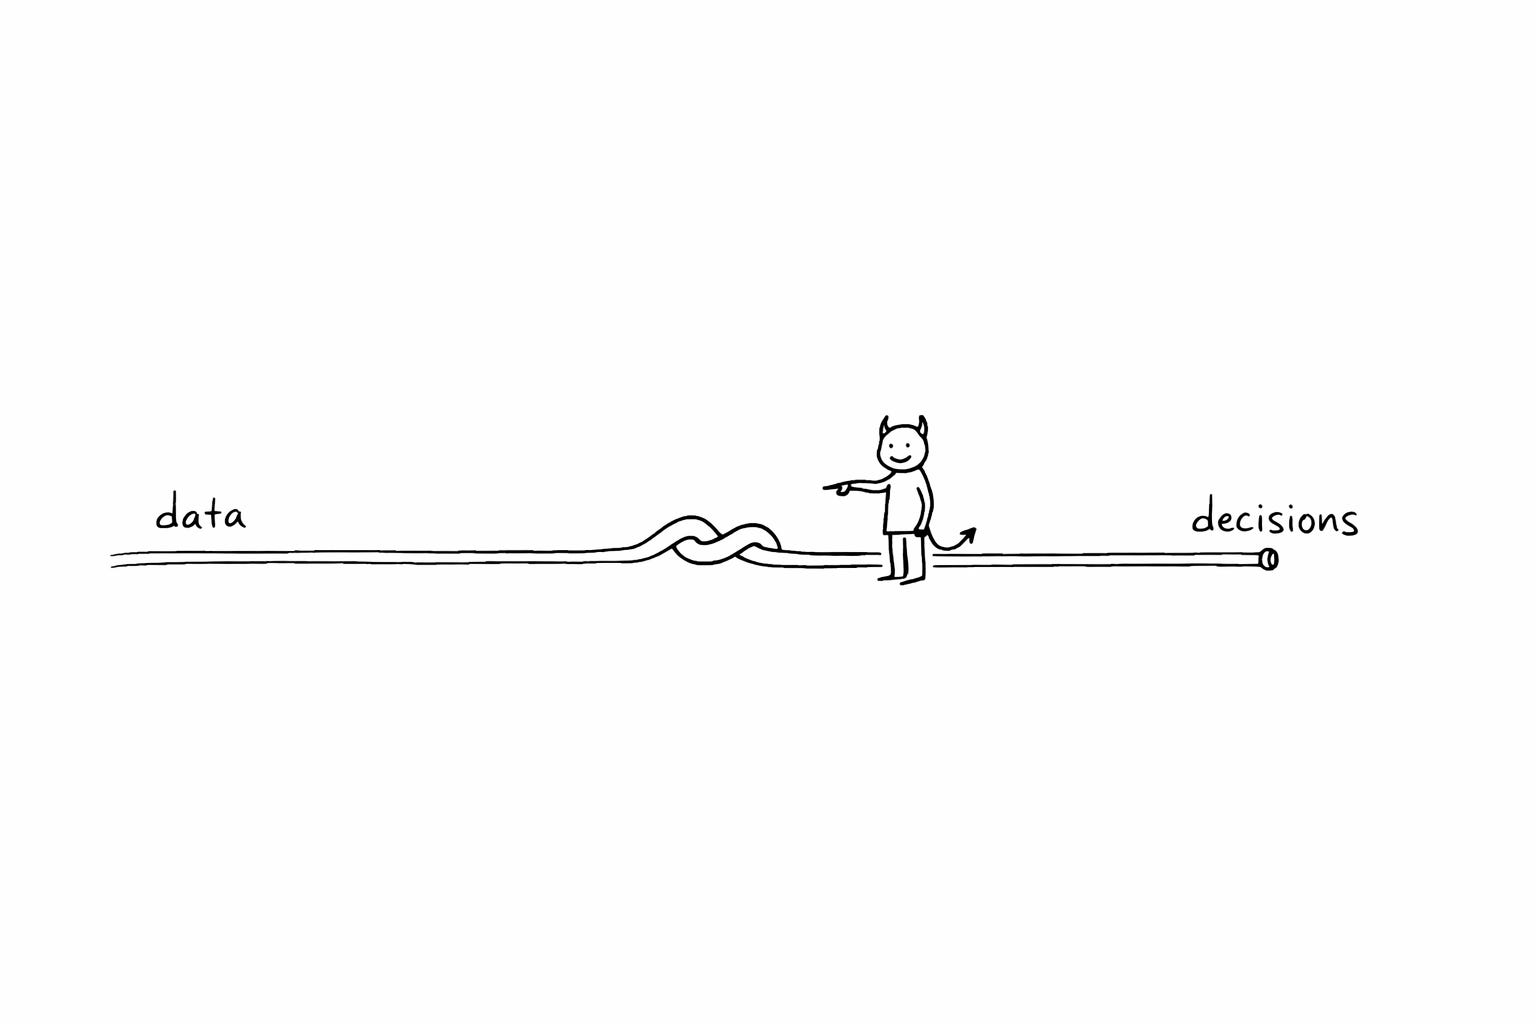
In 2019, a colleague gave a talk featuring a tool called “data built tool.” It was made by some weird consultancy called Fishtown Analytics. It had 1,000 GitHub stars. We figured we could always ditch it later. A few years later, this little project had created an entirely new job title — “analytics engineer” — and the company behind it was valued at over four billion dollars. Dbt Labs became a unicorn not by building revolutionary technology but by undoing a kink in a hose. **
The core invention was templated SQL and a folder structure. That’s it. I’ve spent a decade watching moments like this. Products that became ten times better than everything else, and products that quietly died. The Google Searches, the Netflixes, the Adobes — and the dashboards nobody opens, the analytics startups nobody remembers, the “AI-powered” features nobody uses twice. The difference was never better engineers or fancier algorithms. The difference was that the winners had found a source of power in their data, and had a deliberate way of channeling it. Richard Rumelt, who I consider the best living strategy thinker, defines a good strategy as two things: a source of power, and a guiding policy that channels that power. Not a vision. Not a roadmap. Not OKRs. A data strategy, then, is a source of power that comes from data, plus a guiding policy for how you channel it into your product. Most products don’t have one. They have data activities.
If you only have 5 minutes, I suggest you read this later, it’s worth it. This piece is longer than usual, but I truly believe it to be worth your time.
The One Thing Nobody Talks About
Most data-heavy products (yes AI is just data) fail, a few special become 10x-100x products.
The difference isn’t better engineers, more funding, or fancier algorithms.
The difference is that the winners have a data strategy. And I don’t mean the document your CDO presents once a year at the board meeting. I mean something much more specific, backed into your product.
A good strategy (according to Rumelt) has two things: a source of power, and a guiding policy that channels that power. That’s it. A source of power — something that gives you leverage — and a deliberate way of using it.
A data strategy, then, is a source of power that comes from data, plus a guiding policy for how you channel it into your product.
Find yours right now. Fill in these blanks:
Power: “We win because ________.”
Policy: “Therefore we will ________ (and stop ________).”
**Bet: “**We’re betting this unleashes ________”
If you can’t fill these in by the end of this article, you don’t have a data strategy. You have data activities.
Example (dbt - Fishtown Analytics):
Power: “We win because we found the kink in the hose of decision-making — the wall between data engineers and analysts.”
Policy: “Therefore we remove it by building a bridge on templated SQL (and stop trying to be a complete data platform).”
Bet: “This unleashes decision-making velocity for every medium-sized company.”
Now, data isn’t like other things. And that matters enormously for strategy. It has six properties that are genuinely unique: it’s copyable, compounding, context-dependent, intangible, exponentially growing, and network-effect-ish. Three of these generate most of the strategy landscape. Miss them, and you’ll never find your strategy.
Data can be copied for free. If your data isn’t unique, it isn’t a source of power — anyone can get it. But if you do have unique data, protecting it creates an enormous moat.
Data compounds. A recommendation engine with 10 million data points isn’t just 10x better than one with 1 million — it’s qualitatively different. This is why flywheels are so devastating in data.
Data’s value depends entirely on context. Adobe had decades of photo-editing logs sitting in their servers doing nothing — until generative AI arrived and suddenly those logs were the most valuable training data on earth. Power often hides in plain sight.
These three properties create three families of power. Compounding drives accumulation — systems where data grows and improves over time. Context-dependence drives unlocking — finding power that’s already there but stuck. Copyability shapes how you build — by protecting proprietary data or opening it strategically. The seven strategies are the stable patterns inside these families. If data compounds you design loops; if value is contextual you hunt constraints and native interactions; if data is copyable you decide what to protect vs. open — those pressures produce the seven moves.
Quick diagnosis:
If your product improves with usage → Accumulate.
If value is trapped in handoffs or medium change → Unlock.
If you must manufacture advantage → Build.
You don’t need all seven. You need one.
Power That Accumulates Is the Easiest to Mistake for Luck
You’re in Accumulate if doubling usage improves the product without hiring more humans. If not, jump to “Power That’s Stuck.”
The flywheel that ate the internet. In 1998, Google had one thing going for it: PageRank, a PhD project that produced slightly better search results than AltaVista or Yahoo. That was the initial push.
More people used Google because the results were better. More usage generated more data — what people clicked, how quickly they bounced back, which links they ignored. That data made the algorithms better. Better algorithms produced better results. Better results attracted more users.
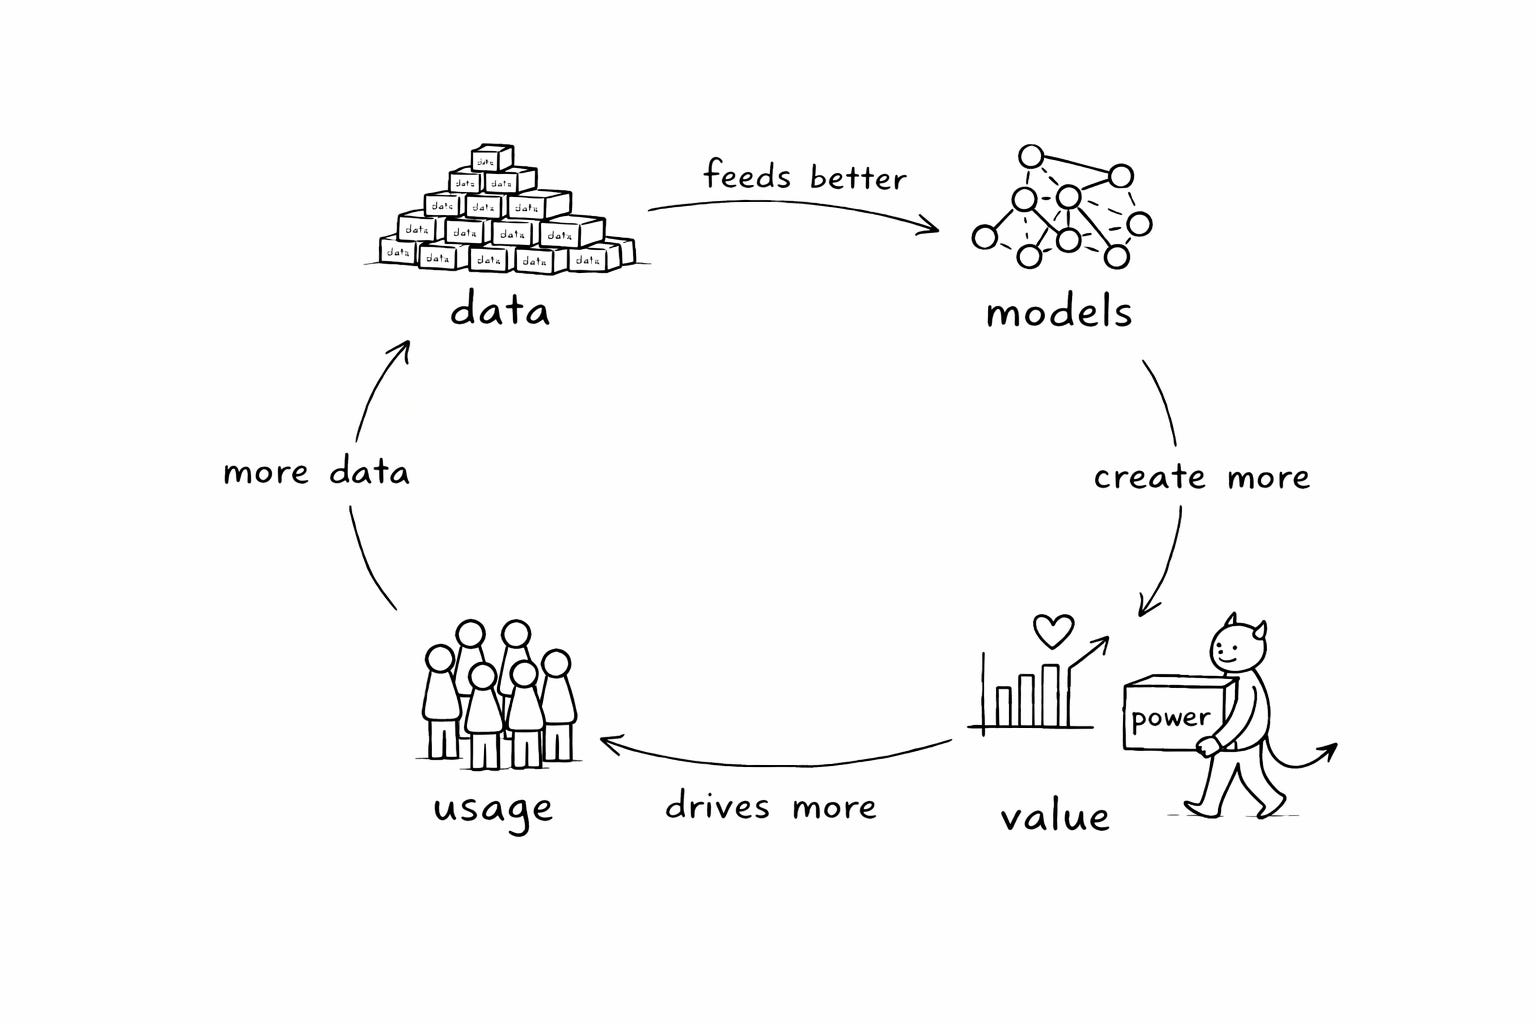
This is what I call the DMVD flywheel:
more Data feeds better Models,
which create more Value for users,
which drives more usage and thus more Data.
It’s not a metaphor — it’s a mechanical description of how certain products accelerate. A flywheel describes momentum, not growth. Any constantly accelerating company will eventually outgrow even the fastest linearly growing competitor. That’s why Google has maintained dominant market share for years. Once the flywheel spins fast enough, you can’t catch up by running harder.
What most teams get wrong. I’ve watched dozens of product teams try to “build a flywheel.” “Let’s add AI, collect user data, create a virtuous cycle!” They build a feature, ship it, and wait for the magic.
It never comes, because they missed the crucial part: the transitions have to be almost automatic. If one step doesn’t naturally trigger the next, it’s not a flywheel — it’s a wishlist. Google tracked how often users returned to the same search results after clicking a link — a deliberate move to enforce the transition from “more usage” to “more useful data.” They even built Chrome (a whole browser!) to get richer data. They asked every single day: what accelerates this?
Any point in the flywheel can be a starting point — the algorithm (Google), the data (Netflix, who had years of DVD rental data before building Cinematch - if you even remember that), or hand-crafted value (Amazon, who started with human-curated top-10 lists before replacing them with algorithms - yes there was a war going on between the algo and the human curation team for years).
If you sell B2B, your flywheel isn’t “more users” — it’s “more usage per account” or “more queries per workflow.”
Ask yourself: What happens if your user count doubles overnight? Does the core experience get noticeably better? If “not really” — you don’t have a flywheel. If “yes, but only if we also improve the algorithm” — you have a flywheel that needs a push. If your product doesn’t compound with usage, stop trying to force it. You’re probably in Unlock or Build. If you notice it’s “stuck” you might want to align it so that the transitions start to be automatic.
And one warning: don’t fight the bully. Your flywheel must turn faster than anyone else’s in your market, or you’ll eventually be eaten alive. DuckDuckGo niched into privacy-focused search — smart — but Google’s flywheel simply spins faster. No amount of running harder closes that gap.
Power: usage data improves the model which improves the product.
Policy: engineer the transitions (instrumentation + incentives) until the loop is automatic.
Monday move: pick one transition (usage→data, data→model, model→value) and instrument it with a metric + an incentive.
The shorter, more violent cousin
The DVD loop skips a step: more Data creates more Value creates more Data. No model improvement — the data is the product.
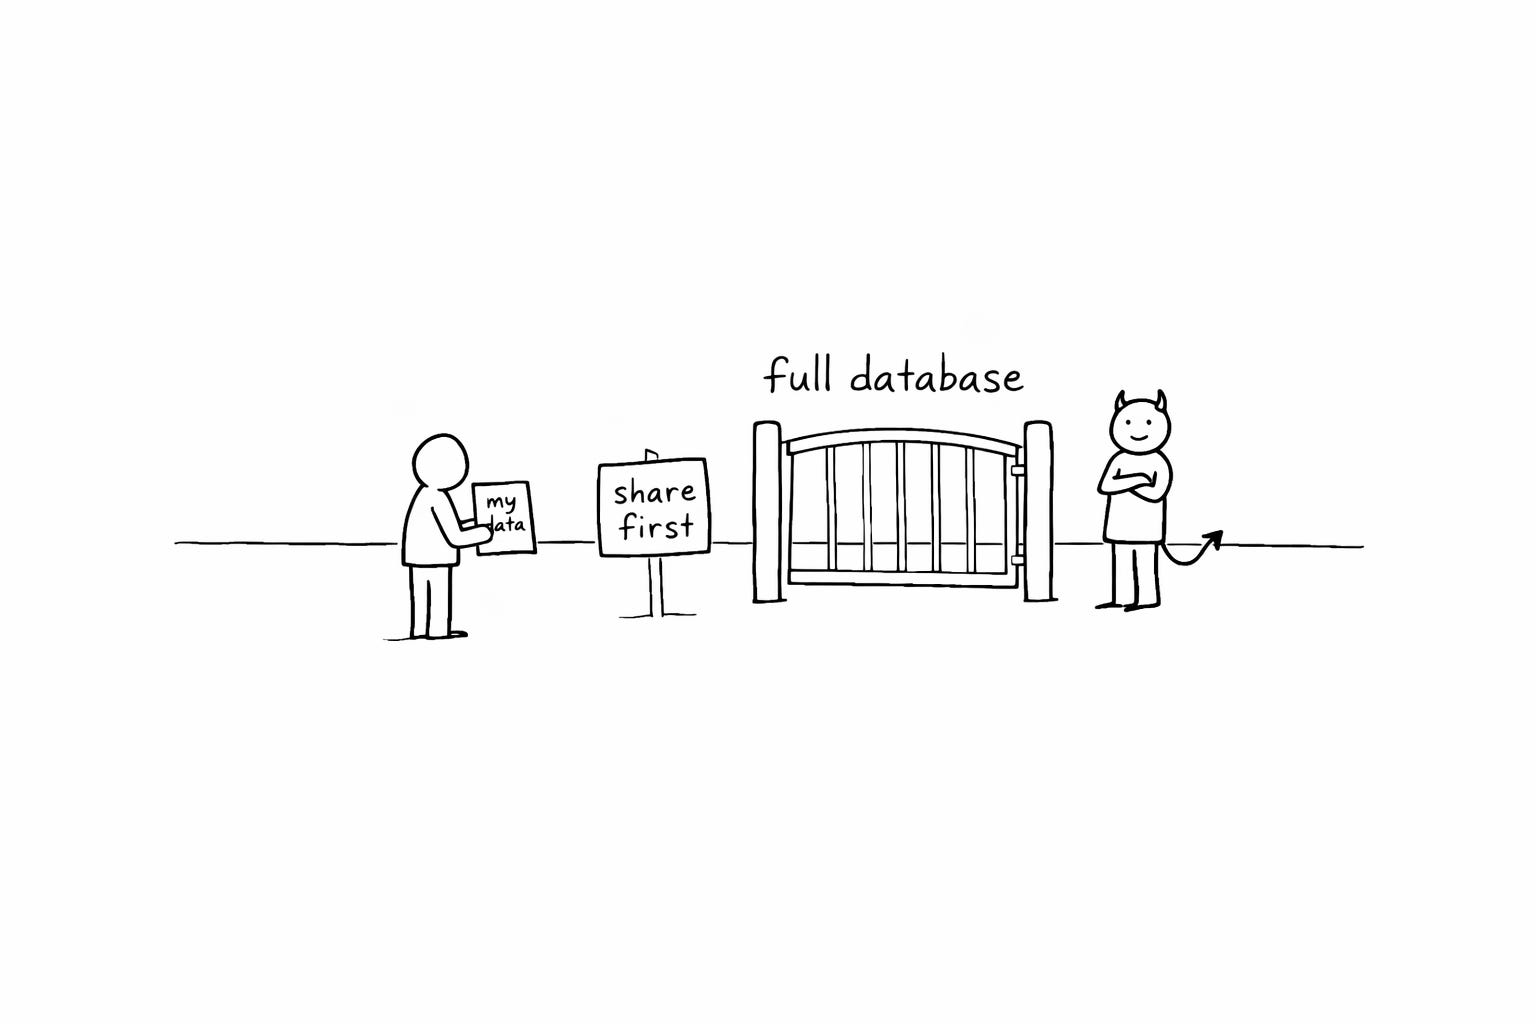
The Farmers Business Network exploits a brutal asymmetry: seed companies know failure rates, yields, and prices across the entire industry. Individual farmers know their own numbers and maybe their neighbor’s. FBN’s solution was a shared data platform — share your data, get access to everyone else’s. More farmers join, more data flows in, the platform becomes more valuable, more farmers join.
Glassdoor works the same way: you can only access the full salary database if you share your own salary first. That’s a direct incentive enforcing the transition in the loop.
The DVD loop is fast and simple, but fragile — it runs entirely on data quality and incentive alignment. If the data turns to garbage, the value proposition collapses overnight. If free-riding becomes easier than contributing, the loop starves.
Direct vs. indirect: Glassdoor requires every user to contribute — you can only access the full salary database if you share your own salary first. That’s a contribution gate: the incentive is baked into the access mechanism itself. GitHub and Wikipedia don’t require contribution — a small percentage creates content, the majority consumes it. That’s a contributor ladder: status, reputation, and visibility reward the people who build.
Contribution gates are faster to start but brutally dependent on data quality — one wave of fake Glassdoor salaries and the whole thing unravels. Contributor ladders are slower to reach critical mass but more resilient once spinning.
First question for a DVD strategy: must every user contribute, or can a subset carry the load? Monday move: either build the contribution gate (Glassdoor) or the contributor ladder (GitHub), and ship the quality enforcement mechanism alongside it.
Power: the data is the product; more contributors = more value for everyone. Policy: design the contribution gate (or contributor ladder) and invest relentlessly in trust.
Before you spin, you need something to spin
And then there’s the foundation that makes flywheels possible in the first place: proprietary data. But not the kind you think.
When generative AI hit, every photo editing company had access to the same technology — the same APIs, the same model architectures. Six months after the breakthroughs, the tech was available to everyone.
But Adobe’s generative fill was magic, and everyone else’s was mediocre. Why? Because Adobe had years of professional photo editors’ workflows logged — how they inpainted, outpainted, replaced backgrounds, adjusted colors — plus one of the largest stock image catalogs in the world. When the technology arrived, Adobe had the training data to make it sing.
The conventional lesson is “collect the exhaust.” But that’s the wrong lesson.
Adobe didn’t construct that data pile strategically. They moved to cloud to save their subscription business. The data was a byproduct — dark data sitting in servers for years. They got lucky. When the context changed externally, they happened to have the right pile.
Luck isn’t a strategy. Here’s what deliberate construction looks like.
Renaissance Technologies didn’t “have better data.” They built better inputs by failing for years.
“They collected every piece of data they could — including lunar phases and sunspots — to test its viability. Most tests failed.”
Most tests failed. That’s the key phrase. Renaissance wasn’t sitting on a goldmine. They were building one, brick by brick, running tests that mostly didn’t work.
The result: 66% average annual gross returns since 1988. Competitors with 100x more “proprietary” data, with 30 years to catch up, never closed the gap.
Renaissance didn’t collect more data than their competitors. They collected different data — weather patterns, shipping manifests, satellite imagery — data their competitors thought was worthless. They bought it cheap precisely because nobody wanted it. Their early data was garbage. The edge came from construction — years of systematic cleaning, combining, and testing to make worthless inputs valuable.
By 1997, more than half of the trading signals they discovered were “non-intuitive” — patterns they couldn’t explain. They traded on them anyway. They called the faint patterns “ghosts” — trends so subtle that most investors couldn’t notice them.
Renaissance never published. Never attended conferences. Never shared insights. For 30 years. When employees leave, they lose access to the Medallion Fund. Knowledge stays inside the building.
Jim Simons once quoted Animal Farm: “God gave me a tail to keep off the flies. But I’d rather have had no tail and no flies.” That’s how he felt about publicity.
The difference between Adobe and Renaissance is the difference between collecting and constructing. Adobe organized what existed and got lucky when the context changed. Renaissance deliberately built inputs that looked wasteful, bet on patterns that looked like noise, and compounded in silence for decades.
Three decisions separate constructors from collectors:
Measure what others won’t. Renaissance bought weather patterns and crop reports when competitors thought it was garbage. What data would look wasteful to collect for 12 months before it might pay off?
Reject the consensus. More than half of Renaissance’s signals were patterns they couldn’t explain — “ghosts” that contradicted conventional wisdom. What industry KPI or “best practice” are you willing to bet against?
Compound, don’t publish. Every insight you share is value you’ll never compound. Renaissance kept signals private for 30 years. What would you never put in a deck?
Collected data commoditizes. Constructed data compounds.
Power: Everyone thinks certain data is garbage — so you can buy it for nothing and construct something massive before anyone notices.
Policy: Make huge, strategic bets on constructing complex data sets that look wasteful — then use the product revenue to fund more construction.
Power That’s Stuck Doesn’t Need More Data — It Needs New Eyes
If customers complain about “handoffs,” “waiting,” “manual stitching,” you’re here.
Not every great data product is built on accumulation. Sometimes the power is already there, sitting in plain sight, and all you need to do is remove the thing that’s blocking it.
The kink in the hose. In 2019, a colleague mentioned a tool called “data built tool” created by “some weird consultancy called fishtown analytics.” It had 1,000 GitHub stars. We figured we could always ditch it later.
A few years later, this little project had created an entirely new job title — “analytics engineer” — and the company behind it was valued at over $4 billion. Dbt Labs became a unicorn not by building revolutionary technology but by undoing a kink in a hose.
All decision-making follows the same sequence: data → info → insight → decision → action. I call it the datacision cycle. Every process has a bottleneck somewhere. What Tristan Handy realized was that in most medium-sized companies, the bottleneck was always in the same place: the wall between data engineers and analysts. Data engineers could collect and store data fine. Analysts could produce insights fine. But the transition — moving collected data into a form analysts could work with — was broken.
Dbt solved this with templated SQL and folder structure. That’s it. It gave analysts the ability to do transformation work that previously required a data engineer, using the language they already knew. And yet that tiny change unleashed enormous power — because the bottleneck wasn’t a local inefficiency. It was the constraint on the entire datacision cycle for thousands of companies. Remove it, and the whole pipeline flows faster.
Finding the real bottleneck is harder than it sounds. When one step is constrained, every other step adjusts its quality to match. That’s why teams misdiagnose bottlenecks — it looks like everything is equally strained. Tristan saw through this: when companies got 10x more diverse data, the system didn’t slow down — it broke entirely at the engineer-analyst handoff. That’s how he found the true constraint.
And there’s the moving bottleneck problem. Release one kink and another appears. Dbt solved transformation; now companies are hitting bottlenecks in data integration, in decision-makers absorbing insights, in pipeline orchestration. Every solution brings you to the next challenge.
If you find a bottleneck — and if it’s common across your target market, it’s a business.
Power: the constraint on the datacision cycle, combined with the mass caught in front of it.
Policy: remove it so thoroughly that the next constraint becomes visible.
When the medium changed but the product didn’t
There’s a second kind of “stuck” power. It’s when the medium you’re building on has capabilities nobody is designing for yet.

TikTok, Uber, Google Maps — they’re not apps that happen to run on a phone. They’re built on the unique strengths of the smartphone: the camera, the GPS, the always-in-your-pocket. The difference is between skeuomorphic and native product design. Skeuomorphic: take an existing process and make it faster with new tech. Native: do something only possible because of the new medium.
Take Granola AI. It’s a meeting note-taker — a small app that sits on top of your video calls, listens to the conversation, and gives you a clean, structured summary afterward. A digital tape recorder with better handwriting. That’s a skeuomorphic product: the old process (someone takes notes) made faster with new tech.
But Granola also lets you ask questions during the conversation. Mid-sentence, while the other person is talking, I’ll glance at Granola and ask it to suggest follow-up questions based on what was just said — questions I wouldn’t have thought of because I was busy listening. Or I’ll ask it to clarify something the other side said three minutes ago that I half-caught but didn’t want to interrupt for. No human note-taker can do this. No recording-after-the-fact can do this. Only a model that’s listening live, processing context in real time, and surfacing intelligence while the conversation is still happening can do this.
That’s a native product — something only possible because AI can sit invisibly inside a live conversation. The medium isn’t “better notes.” The medium is an always-on cognitive partner embedded in the interaction itself.
Native products kill skeuomorphic ones. DoorDash killed phone-ordering pizza. Uber killed calling a cab. Once Granola shifted from “better notes after” to “better thinking during,” every traditional note-taking tool became irrelevant — and every AI meeting tool that only delivers a summary afterward became the next cab company.
For your product, ask: what can my medium do that others can’t? What can users do now that was physically impossible before this medium existed? The internet separates intent from compute on a worldwide scale. Smartphones combine camera, GPS, and always-on connectivity. AI embeds intelligence inside processes that used to be purely human. The native strengths are where the 10x product lives. If you’re only using new technology to do the old thing slightly better, someone will build the thing that’s only possible in the new world.
Monday move: list the three things your medium can do that the previous medium couldn’t. If your product only uses one of them, you’re skeuomorphic — and vulnerable.
Power: the medium enables actions previously impossible.
Policy: design the product around the medium’s native strengths before someone else does.
Power That’s Built Is the Hardest to Copy
You’re here if you can’t out-data incumbents and there’s no obvious kink — you need to manufacture an edge.
Sometimes you don’t have data that compounds, and there’s no bottleneck to release or new medium to exploit. Sometimes you have to manufacture the advantage. Hardest path, but extraordinary moats.
University research that became infrastructure. In 2009, researchers at UC Berkeley were working on a distributed computing problem. Hadoop wrote intermediate results to disk — slow, painful, limited. The Berkeley team kept data in memory. They called it Spark.
Spark didn’t just make processing faster. It made an entire category possible: real-time analytics at scale, iterative machine learning, interactive data exploration.
Databricks formed in 2013 to commercialize Spark. The strategic decision: open-source Spark while building proprietary tools on top. Open source drove adoption. The proprietary platform (managed Spark, MLflow, Delta Lake) captured value.
This is the core tension of Data R&D: you have a temporary advantage from research, and you must decide what to open vs. lock down.
New processing tech for a new use case (like Spark) → open up aggressively. You need the ecosystem. If you need other systems to adopt you, openness buys integration.
New algorithms for an existing solution (like PageRank) → lock everything down. The use case is understood; opening up just helps competitors.
In between → careful balance. ChatGPT keeps algorithms tightly controlled but offers broad API access.
The uncomfortable truth: R&D advantages are temporary. Always. Commoditized in 18 months. Databricks didn’t stop at Spark — they built MLflow, Delta Lake, Unity Catalog. R&D only works if you use the temporary advantage to build something more durable — a flywheel, a proprietary dataset, an ecosystem. R&D is the spark (pun intended), not the fire.
Power: algorithmic or technological edge from research.
Policy: use the temporary advantage to build durable structural power (flywheel, ecosystem, proprietary data).
When no single piece is impressive, but the system is
The last strategy is the one most product managers instinctively avoid, which is exactly why it’s so powerful.
Synthesia is an AI-powered video creation platform valued at over a billion dollars. The video generation isn’t as good as dedicated research models. The text-to-speech is competent but not remarkable. The UI is clean but not revolutionary.
And yet people use it to create thousands of corporate training videos. The product works — not because any piece is exceptional, but because the pieces work together so seamlessly that the whole is dramatically greater than the sum of the parts. That’s a chainlink product.
Building a chainlink means building multiple components simultaneously and integrating them tightly. Terrifying. But that’s what creates the moat — the value lives in the integration, not in any single component. A competitor can’t copy one piece and replicate your product. They’d have to copy the system.
Two paths: build from scratch around a narrow use case (Synthesia for corporate training videos), or add links to an existing strong product (Adobe Premiere with AI features layered on top). Both work; they produce different products optimized for different segments.
Monday move: pick one narrow use case; list the 3–4 links; define the integration moments where the chain must feel seamless.
The risk: commoditization. If one link becomes a free API, the ecosystem shifts to commoditize the next. Your defense is tightening the integration so the system stays unique even as components become available elsewhere.
Power: integration creates system-level value competitors can’t copy link-by-link. Policy: narrow use case + tighter seams + continuous integration advantage, and a long term perspective.
The Choice That Changes Everything
If you’ve read this far, you might be thinking: “Great, I’ll combine the flywheel strategy with proprietary data and add some R&D for good measure.” That sounds comprehensive. Strategic, even.
It’s the opposite of strategy.
The whole point of this framework is to help you identify your one source of power and channel everything into it. Here are all seven. Read them as a diagnostic — which one describes the leverage that already exists (or could exist) in your product?
Proprietary Data — you own data nobody else can replicate. You’re this if your competitors would pay a lot for your dataset.
DMVD Flywheel — usage creates data that improves models that creates more usage. You’re this if usage improves the model.
DVD Loop — the data is the product, and more users means more data means more value. You’re this if the raw data is the value, no model needed.
Bottleneck — you remove the constraint in turning data into action. You’re this if handoffs kill throughput.
Native Design — the medium changed and you exploit what’s now possible. You’re this if your product is impossible without the new medium.
Data R&D — you have an algorithmic or technological edge, and you know what to open vs. lock down. You’re this if your advantage is a research breakthrough.
Chainlink — the integration is the moat, not any single component. You’re this if no single piece is best-in-class but the system is magic.
Here’s what to do Monday morning. Four questions, one piece of paper:
What is our power source? If you can’t name it in one sentence, you don’t have a data strategy.
What is our guiding policy? “We use data to improve the customer experience” is not a policy. “We enforce every transition in our DMVD flywheel by measuring bounce-back rates on every search result” — that’s a policy.
What do we stop doing? Strategy means saying no.
Accumulate: stop all projects that don’t feed the loop.
Unlock: stop “collect more data” as the default; map the constraint instead.
Build: stop feature-parity shipping; invest in the edge (R&D / integration seams).
What is the one transition, bottleneck, or integration we bet on? Name it specifically.
In 2019, my colleague didn’t know he was showing us a four-billion-dollar company. Neither did the people who built it, probably. What Tristan Handy knew was that there was a wall between data engineers and analysts, and that wall was the constraint on every decision cycle in every medium-sized company he’d ever worked with. Templated SQL was how he removed it. That was his source of power. That was his guiding policy. One constraint. One bet.
Google’s bet was bounce-back rates on search results — one transition in one flywheel, enforced every single day. Adobe’s was dark data sitting in servers for years, data they collected to save their subscription business, not to train AI models that didn’t exist yet. FBN’s was asking farmers to share what they already knew.
None of them started with seven strategies. They started with one.
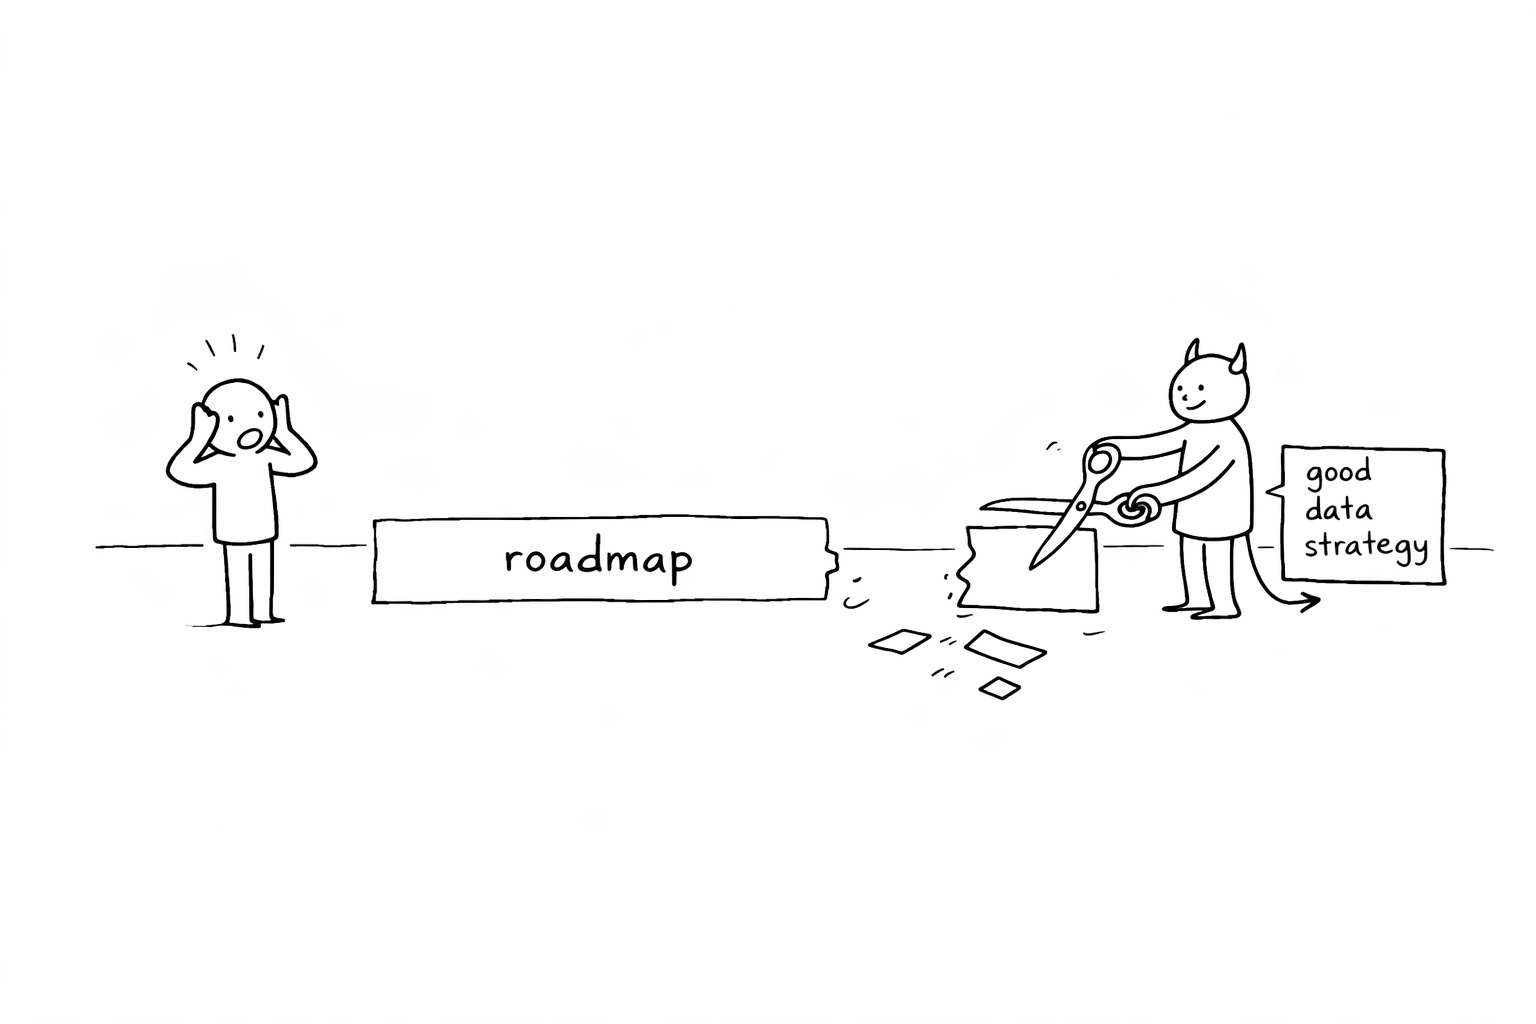
So here’s what you do Monday morning. Take a piece of paper. Write your power source in one sentence — if you can’t, you don’t have a data strategy, you have data activities. Write your guiding policy, and not “we use data to improve the customer experience” — something with teeth, something that names what you’ll stop doing. Name the one transition, bottleneck, or integration you’re betting everything on. Name what moves in thirty days.
If you can’t fill in those sentences, you’re not allowed to build anything new this week.
Write your power and policy. Then cut half your roadmap.
As you may know, I’ve already written a short book on those data strategies, but I’m contemplating about writing a fully updated version. If you’re interested, reach out to me!
Great article. Thank you!