
You don't have 47 data problems. You have one.
Quality matching makes every part of your system look equally broken. It's a lie. Here's how to find the real bottleneck in two hours.

The dashboard shows 47 alerts. The lineage graph shows 200 dependencies. You’re still grabbing duct tape.
Six months ago, you bought the observability tool. Monte Carlo, Metaplane, Bigeye—doesn’t matter which. The pitch was compelling: visibility into your data pipelines. Know when things break before stakeholders complain. Finally get ahead of the firefighting.
Now you have visibility. You can see exactly how broken everything is. The alerts ping Slack at 6 AM. You fix three issues before standup. Four more appear by lunch. Everything looks equally urgent. Everything looks equally broken.
I’ve been on both sides of this. Bought the tools. Watched the alerts multiply. Then found the actual fix—and it wasn’t more dashboards.
Here’s what the observability industry won’t tell you: the dashboard is telling the truth, and that’s the problem.
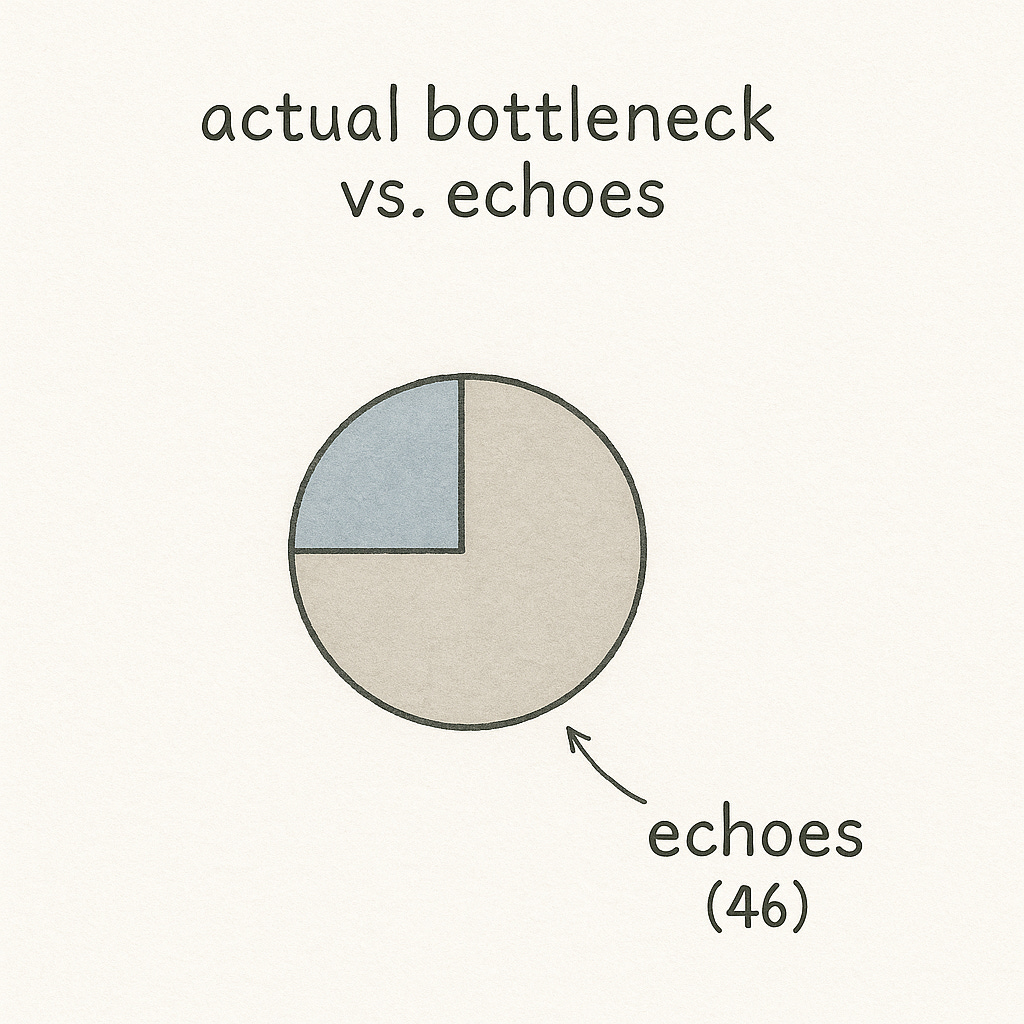
You don’t have 47 problems. You have one. The other 46 are quality matching—your entire system adjusting to operate at bottleneck speed, creating the illusion that everything is equally strained. Observability tools show you the illusion in high definition. They’re not built to show you the constraint.
They never will be. Their business model depends on more alerts, not fewer.
⏱️ If you only have 5 minutes: here are the key points
You don’t have 47 separate data problems—just one true bottleneck. The rest are symptoms, amplified by system-wide quality matching.
Observability tools amplify noise. They show real symptoms but can’t identify the root constraint causing them.
Stop asking “what’s broken?” and start asking “what breaks first under stress?” Use the volume, velocity, variety framework to stress-test your system.
Trace alerts back to convergence points. That’s where the bottleneck lives.
Fix the constraint, and the 46 echoes disappear. One fix often resolves the cascade.
Cancel the dashboard if it’s not driving action. Instead, invest engineer time in mapping and fixing the system architecture.
Quality matching: why your gut was right all along
You’ve suspected this for months. Every time you fix an alert, two more appear. The dashboard never gets greener. The firefighting never stops. Something feels wrong about the whole approach.
Your gut is right. Here’s why.
When a system has one true bottleneck, every other component adjusts to match it. Upstream processes slow down—no point producing faster than the bottleneck can consume. Downstream processes degrade—they’re starved of quality input. The whole system synchronizes to the weakest link.
This creates a brutal illusion. You look at your platform and see twenty things failing. But they’re not separate failures. They’re one failure, echoing.
Observability tools can’t tell the difference. They show you every symptom in real-time. They generate 47 alerts because technically, 47 things are below threshold. What they can’t show you is that 46 of those alerts vanish when you fix the one that matters.
This is why the tools feel useless. Not because they’re lying. Because they’re telling you the truth about symptoms while hiding the disease. You’re not bad at using them. They’re bad at solving the actual problem.
Every data leader I know who bought observability tools and still drowns in alerts has the same quiet suspicion: this isn’t working. They’re right. It was never going to work. The architecture of the solution is misaligned with the structure of the problem.
What actually works
When I took over the data team at Mercateo, the data platform was drowning. The company moved from a monolith to microservices, and suddenly the data team had 20+ sources to ingest instead of one. The symptoms were everywhere:
Lead times to add new data sources: exploding
Lead times to create reports and dashboards: exploding
Data quality across the system: declining
We could have bought observability tools and watched the decline in 4K. And guess what, we did. We implemented tracking, tracing, lineage, everything we needed to. Took us months of development time only to confirm: Stakeholders still are very unhappy. Only to send us fire fighting every single day.
So then, we asked a different question.
Not “what’s broken?” but “what breaks first when we stress it?”
We stress-tested three dimensions. Could we handle 10x more volume? Yes—the warehouse scaled fine. Could we handle 10x more velocity? Yes—latency wasn’t the issue. Could we handle 10x more variety—new sources, new schemas, new domains?
The system collapsed. In hindsight, obvious, but not at all when you’re in fire fighting mode.
Our legacy ETL architecture couldn’t adapt. Little testing. No CI integration. Every improvement meant fighting the system itself. So improvements didn’t happen. Quality degraded everywhere. Lead times expanded everywhere. Everything matched the bottleneck.
One constraint. One fix—migrate to ELT with dbt and CI/CD.
Data failures dropped by a factor of 10.
Not because we triaged better. Not because we had better visibility. Because we found the one thing that was actually broken and fixed it. The 46 other “problems” were never problems. They were echoes.
The three-fold test
Observability asks “what’s broken?” Wrong question.
The right question: “what breaks first when you stress it?”
Volume, variety, velocity.
Can your system handle 10x more data of the same type?
Can it handle 10x more diverse data—new sources, new schemas?
Can it handle the same data 10x faster?
Whichever dimension breaks first is your constraint. Everything else is quality matching.
Trace your noisiest alerts backward. Don’t fix them—map them. Somewhere, those alert paths converge. A transformation layer. An ingestion bottleneck. A legacy system choking on schema changes. That convergence point is where you apply the stress test.
Two hours with a whiteboard will tell you more than two years with a dashboard.
Cancel the dashboard
Let’s talk about incentives.
Monte Carlo’s business model depends on you having alerts to monitor. Metaplane profits when your lineage graph is complex. Bigeye wants you to set more data quality rules so you get more alerts so you need more Bigeye.
No observability vendor will ever ship “find the one constraint and make 46 alerts disappear.” That’s the opposite of their retention strategy. Their product gets more valuable when your system gets more broken.
Do you think when we migrated our system the first thing we did was to fire up the observability again? No, because we already had found the bottle neck! We could get back to delivering business value, fast.
They’re selling you a flashlight to watch the flood. What you need is a pump.
The $50k alternative. Cancel the subscription. Take one data engineer off the alert treadmill. Give them 30 days to do nothing but find bottlenecks.
Not triaging alerts. Not building dashboards. Not responding to Slack pings. Just finding the constraint.
Map the system. Apply the three-fold stress test. Find where the paths converge. Fix it or build the case to fix it.
One engineer focused on the actual problem will resolve more in 30 days than two years of dashboard-watching.
The math
Here’s what nobody in the observability industry wants you to calculate:
At Mercateo, before we found the constraint, our data team was spending at least 10 hours a week on firefighting. That’s 500 hours a year. Add the tool cost. Add the cognitive drain. Add the slow bleed of morale when the dashboard never turns green.
We were spending six figures annually to manage symptoms.
The architectural fix took effort. It wasn’t free. But it was one thing. And when it was done, it was done. The failures didn’t drop by 10% and creep back up. They dropped by 90% and stayed down.
That’s the difference between treating symptoms and curing disease.
The observability industry built its business on a simple premise: if you can see the problem, you can fix the problem.
That’s just plain wrong, you have to see the right problem, and observability, tracing, lineage isn’t bringing you closer to that.
Seeing 47 problems doesn’t help when you have one problem generating 46 echoes. Visibility into a quality-matched system isn’t insight—it’s noise at higher resolution.
Your gut knew this. Every time you cleared an alert and felt nothing change. Every time the dashboard stayed amber. Every time you wondered if the tool was actually helping or just making the chaos more visible.
You were right to doubt.
Now stop watching the flood and find the pump.