
Why smart companies waste millions on 'proprietary data'
How Amazon and Netflix built data moats through observation access, not collection.

Three months into poker coaching, a couple grand in fees deep, my coach drops this: “Stop analyzing your own hands. Just buy the database.”
Seriously? I’d been doing everything right. Poker Tracker running constantly. Detailed notes. A spreadsheet tracking patterns in 3-5 person post-flop games. Months of painful lessons earned through blown buy-ins.
“Every serious player above NL100 has learned the same lessons. You’re spending months discovering documented patterns. Just buy the aggregate data.”
He was right. Within days of purchasing hand history databases, I was learning in hours what took me months to discover. Not because my data was bad. Because I wasn’t the only competent poker player documenting these patterns. My personal data, the one I was collecting, wasn’t proprietary. The behavior was common.
Years later as a Data PM, I made the same mistake at 10x the stakes.
I spent a day shadowing our top sales rep. She prioritized accounts using patterns observed over eight years covering the same region through two economic downturns. Her Excel sheet tracked how customer responsiveness shifted when budgets tightened—patterns that took a decade to surface. And tons of experience.
Our dashboard tracked 1-2 years. We literally couldn’t observe what she’d observed. The behaviors only emerged across longer time horizons. We thought we had proprietary sales insight. But we really had truncated commodity data.
Same mistake. Different stakes.
Here’s what I’ve learned: Companies spend millions on “proprietary data” infrastructure that creates zero competitive advantage. They’re observing the same human behavior everyone else can see. A16Z put it bluntly in April 2024:
“Data has long been lauded as a competitive moat... we now wonder if there’s practical evidence of data network effects at all.”
When they asked vertical AI companies about data moats, the response was sharper:
“data moat is bullshit.”
The problem isn’t data quality or collection infrastructure. The problem is that most “proprietary data” is worthless because the underlying human behavior isn’t unique.
You think you have proprietary data because users upload data to your platform? Your competitors have users uploading similar data. The behavior isn’t unique to your platform. Your “proprietary” insights are reproducible by anyone observing similar populations.
The companies that actually built data moats—Amazon and Netflix—didn’t win by hoarding more data. They won by positioning themselves to observe unique human behavior competitors literally could not see.
This article shows you how to tell the difference. Three diagnostic questions. Applied to Amazon and Netflix. Then what you can do about it, right now.
If you only have 5 minutes: here are the key points
Most “proprietary data” is a myth. If your competitors can observe the same user behaviors, your data is likely commodity—even if collected meticulously.
Unique insights come from exclusive observation, not better instrumentation. Companies like Amazon and Netflix built durable moats by observing behaviors that competitors couldn’t see—not by collecting more of the same data.
Three questions to diagnose real data moats:
Population Access – Are you observing a group that competitors can’t?
Behavioral Context – Does your product design surface behaviors unique to your environment?
Temporal Advantage – Are you seeing behaviors before others do, giving you time to build compounding insights?
Examples of true data moats:
Amazon observed digital shopping patterns before others entered e-commerce.
Netflix tracked in-platform viewing behaviors unavailable to physical or broadcast competitors.
Actionable audit: Run your data through the 3-dimension test. Invest in datasets that pass 2+ dimensions. Kill investments in commodity data—even if it feels “proprietary.”
The commodity data trap
The test is simple: If competitors with similar users do observe similar patterns on a reasonable level of abstraction, your data is commodity.
Doesn’t matter how carefully you collect it. Doesn’t matter how sophisticated your infrastructure is. If the underlying human behavior is common, the data creates no moat.
Standard user analytics? Every app tracks clicks, sessions, conversions. Transaction logs? Every platform captures purchase data. User uploads? Your competitors have users uploading similar content. Market research? Everyone observes the same publicly visible trends.
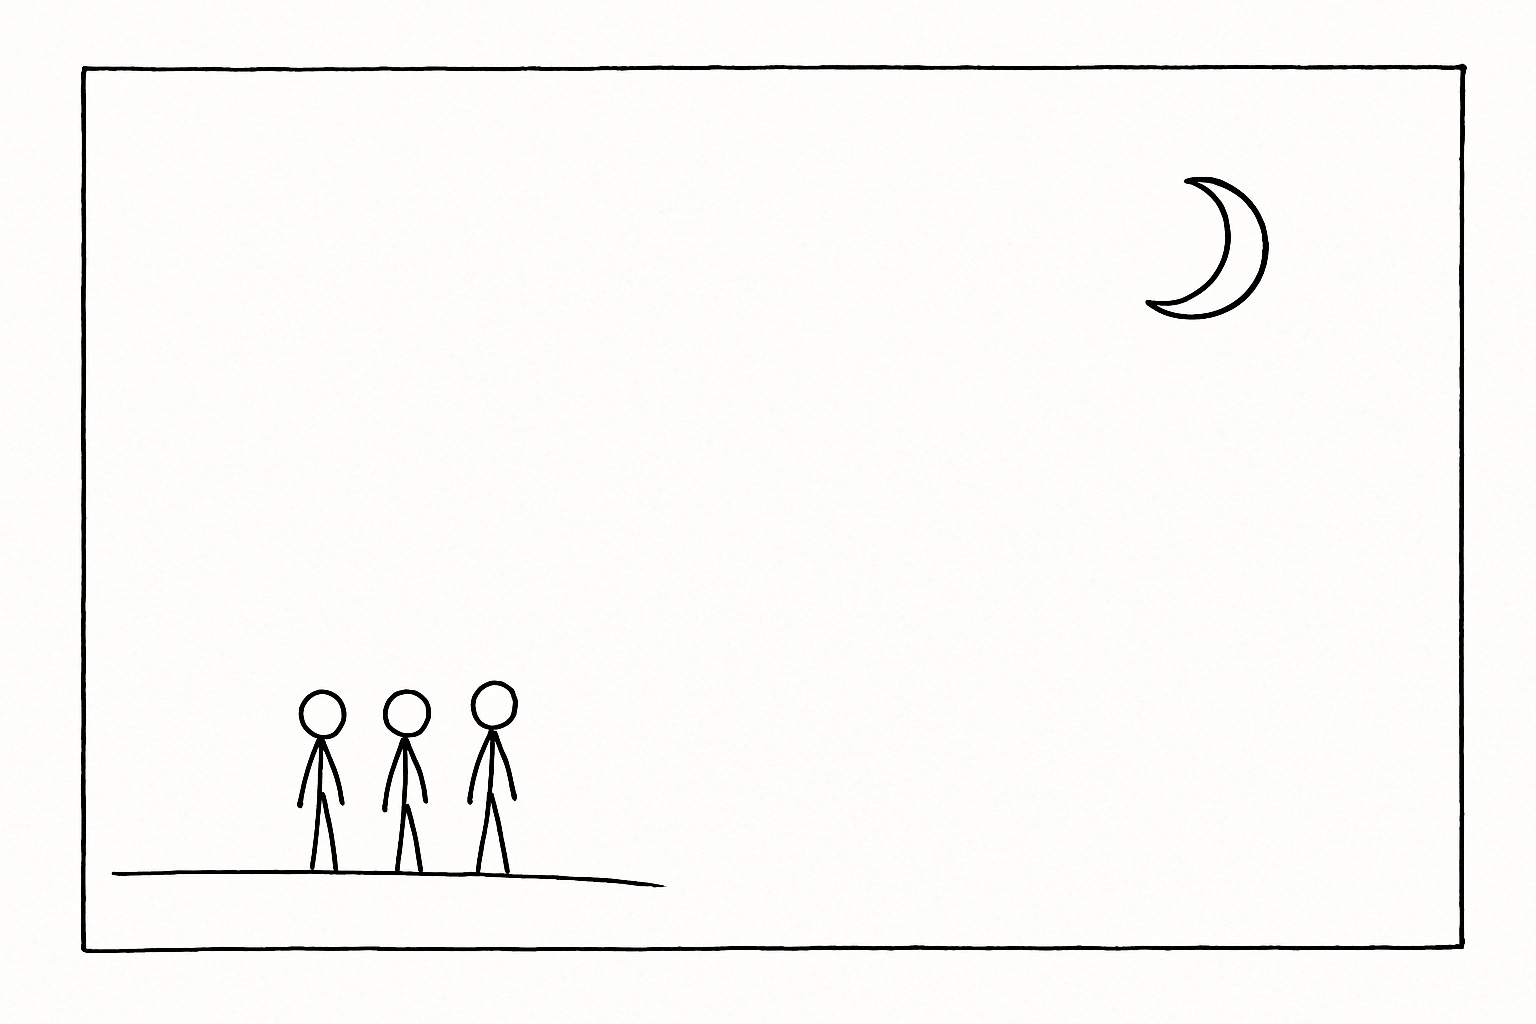
You’re building better telescopes to watch the same moon everyone else is watching.
The trap seduces companies into expensive infrastructure investments—data warehouses, data teams, tracking systems, access controls—while competitors simply observe the same behaviors through different but equally accessible vantage points.
Take customer feedback data. You survey your users. Competitors survey their users. You’re both observing how people respond to survey questions about product satisfaction. The underlying behavior—people forming opinions about products and expressing them when asked—is universal. Your survey data isn’t proprietary. The human behavior you’re observing is common to everyone with customers.
Or consider user engagement metrics. You track daily active users, session length, feature usage. So does every other app. You’re both watching people open apps, click buttons, and close apps. The granular details differ, but the behavioral patterns—people using software to accomplish tasks—are identical. Your engagement data creates no advantage because competitors observe functionally equivalent behaviors from their user base.
Real moats look different. They come from exclusive observation access to unique human behaviors. Not better collection. Different behaviors that only exist in specific contexts competitors cannot replicate.
Amazon’s observation advantage
Amazon in 1997-2004 wasn’t special because they tracked purchases. Every retailer tracked purchases. They were special because they observed what happened when you removed inventory constraints from shopping behavior. They saw things like this:
“Customer buys a $12 book at 2am. Gets algorithmic recommendations for camera equipment. Adds to cart. This cross-category jump happened thousands of times daily. A 10% price drop in books increased electronics browsing by 40% within 24 hours.”
Here’s what most people don’t know: Amazon pioneered item-to-item collaborative filtering, a breakthrough that let them make real-time recommendations at scale. While competitors struggled with user-based filtering systems that couldn’t handle millions of customers, Amazon’s 2003 algorithm—developed by researchers Greg Linden, Brent Smith, and Jeremy York—became so influential that IEEE Internet Computing named it the best paper in their 20-year history.
The innovation wasn’t just technical. It revealed behavioral patterns invisible to physical retail. Amazon discovered that customers who read reviews in one category became 3x more likely to purchase in completely unrelated categories. They observed that unlimited inventory browsing created cross-category discovery behaviors that couldn’t exist when shelf space was constrained. They learned that algorithmic recommendations could trigger purchasing decisions across product boundaries that physical store layouts actively prevented.
This is new human behavior. Walmart shoppers don’t browse unlimited inventory at 2am. They don’t discover camera equipment while buying books because physical layout prevents it. They don’t read electronics reviews in the book aisle. The spatial and temporal constraints of physical retail made these behaviors impossible.
Take a look what this data has:
Population Access: Amazon had exclusive access to early internet adopters (1997-2004) making online purchases at scale. Walmart had in-store shoppers. The populations exhibited fundamentally different behaviors.
Behavioral Context: The behavior—price-driven cross-category discovery without spatial constraints—only existed in digital unlimited-inventory contexts. Physical retail couldn’t replicate it even if they wanted to.
Temporal Advantage: Amazon observed digital shopping behaviors from 1997-2004 before major retailers launched serious e-commerce. Seven-year window to build compounding insights about algorithmic recommendations, cross-category discovery, and digital shopping patterns.
Amazon’s advantage has lasted 25+ years not because they observed one unique behavior forever, but because they continuously repositioned for new unique behaviors. First: digital shopping (1997-2004). Then: Prime membership behavior and how free shipping changed purchase frequency (2005-2010). Then: AWS cloud adoption patterns and how developers made infrastructure decisions (2006-2015). They didn’t rely on one observation advantage—they stacked multiple temporal windows.
Netflix’s observation advantage
Blockbuster tracked rentals. Netflix tracked viewing. The difference matters more than you’d think.
When someone rented from Blockbuster, that’s all Blockbuster knew—it got rented, maybe returned late. Transactional data.
Netflix saw consumption behavior. Watched 15 minutes and quit? They knew. Watched twice in one weekend? They knew. Immediately queued the sequel? They knew.
Here’s what’s not widely known: By 2014, Netflix had developed 76,897 micro-genres using over 1,000 different tag types to classify content by genre, time period, plot conclusiveness, mood, and dozens of other attributes. This granular classification, combined with viewing data, meant Netflix knew not just that you watched crime dramas, but specifically that you preferred “dark European crime dramas with strong female leads and ambiguous endings.”
More importantly, Netflix discovered that 75-80% of viewer activity was influenced by their recommendation algorithm—meaning they could observe how recommendation systems shaped viewing behavior at scale, something broadcast TV and physical rental could never see.
They learned that episode boundaries mattered more than time for binge-watching. People would stop after finishing an episode, even if they’d only watched 45 minutes, but would continue through multiple episodes in marathon sessions if the cliffhangers worked. They could see exactly which shows had high completion rates versus high abandonment rates. They knew which season finales triggered immediate season 2 starts.
Netflix has what Amazon had:
Population Access: Netflix had exclusive access to DVD-by-mail subscribers (2000-2007), then streaming subscribers (2007-2012) before HBO Go launched. Different populations than broadcast TV or rental customers.
Behavioral Context: Binge-watching behavior only existed in their streaming interface—zero friction, no broadcast schedules, algorithmic “next episode” prompts. Didn’t exist on broadcast TV. Didn’t exist in Blockbuster. The interface created the behavior.
Temporal Advantage: Five-year window (2007-2012) observing streaming consumption before Disney+, HBO Max, and other services launched. Learned which originals keep viewers engaged, what completion rates predict retention, how cliffhangers actually work to trigger consecutive viewing.
Why did Amazon’s advantage last 25 years while Netflix had 5-year windows? Amazon continuously repositioned for new unique behaviors. Netflix’s advantage compressed because streaming behaviors standardized faster. Once Disney+, HBO Max, and others launched, streaming consumption behaviors became universal. The observation access evaporated.
The lesson: Temporal advantages vary by how fast behaviors standardize across competitors.
The three dimension test
Run every “proprietary” dataset through these three questions. Most will fail. The ones that pass are worth 10x the investment.
Dimension 1: Population access
Can competitors observe this same population?
How to answer it: List your data sources (user base, transaction logs, usage data). For each source, ask: “Could a competitor with a similar product collect equivalent data from their users?” If yes, you’re observing a common population. If no, identify what makes your population exclusive.
Walk through it: You have mobile app users. Your competitor has mobile app users. Both of you observe people using smartphones to accomplish tasks. Common population. Now consider: You have early adopters of a new technology that competitors haven’t reached yet. Those early adopters exhibit different behaviors than mainstream users because they’re comfortable with incomplete features and willing to tolerate bugs. That’s exclusive population access—for now.
Pass criteria: Your population exhibits behaviors in contexts competitors cannot access. Amazon’s early internet shoppers (1997-2004) exhibited digital shopping behaviors physical retailers couldn’t observe. Netflix’s streaming users (2007-2012) exhibited binge-watching behaviors broadcast TV couldn’t see. Claude’s conversational AI users (2024-2026) exhibit multi-turn reasoning behaviors that search engines and traditional chatbots don’t capture. Is your product unique in some way? Can you capture unique behavior at a scale that is hard to replicate?
Fail criteria: Competitors with similar products observe similar populations. Mobile app analytics—all apps have mobile users. B2B transaction data—all B2B companies have transactions. Job posting data—all job boards see applications. You’re watching the same populations make the same types of decisions.
Dimension 2: Behavioral context
Does this behavior only exist in your context or everywhere?
How to answer it: List the key behaviors you’re observing (browsing patterns, purchase sequences, usage frequency). For each behavior, ask: “Is this behavior happening on a competitor’s platform or in a different context?” If yes, it’s universal behavior. If no, identify what about your context creates unique behavior.
The test: Remove your specific product. Does the behavior still exist? If people exhibit the same behavior using competitor products or in offline contexts, it’s universal. If the behavior only emerges because of your specific product design, interface, or constraints, it’s context-specific.
Pass criteria: The behavior emerges specifically because of your product’s unique context. Netflix binge-watching only existed with zero-friction streaming interfaces and algorithmic “next episode” prompts. Uber surge pricing responses only existed in real-time visible marketplaces where riders could see supply/demand and choose to wait or pay more.
Fail criteria: The behavior exists universally across similar contexts. People search for information—happens everywhere. People make purchase decisions—happens on all e-commerce platforms. People upload content—happens on all platforms with user-generated content. The behavior isn’t unique to your context.
Dimension 3: Temporal advantage
Are you observing emerging behavior before it becomes common?
How to answer it: Identify when you started observing this behavior (month/year). Estimate when competitors will reach similar observation scale. Calculate your exclusive observation window. Ask: “Is this window long enough (12+ months) to build compounding advantages?”
The calculation: Started observing in January 2024. Competitors will reach scale by June 2025. Window = 18 months. Long enough to build product improvements, operational efficiencies, and strategic insights competitors must learn from scratch.
But here’s the trap: Observation windows only matter if you’re actually building compounding advantages during them. Having exclusive observation access for 18 months means nothing if you don’t use that time to develop insights that inform better product decisions, operational improvements, or strategic positioning.
Pass criteria: You have 12+ months of exclusive observation before competitors reach scale. You’re using this window to build compounding insights that improve your product, operations, or strategy. Tesla observed EV charging patterns from 2012-2016 before traditional automakers sold EVs at volume. Airbnb learned short-term rental hosting behaviors from 2010-2014 before VRBO moved upmarket.
Fail criteria: Competitors already observe similar behaviors at scale. Your observation window is under 12 months. You’re not using the window to build compounding advantages. The behavior is already well-understood across the industry.
Your Monday audit
Open your data strategy deck. Find the slide that says “proprietary data advantage.” (Or simply go crazy and brainstorm)
Step 1: List every “proprietary” dataset
Write them down. User analytics. Transaction logs. Usage patterns. Customer uploads. Whatever you’re calling proprietary.
Step 2: Run the three-dimension test
For each dataset, ask all three questions:
Can competitors observe this same population?
Does this behavior only exist in your context?
Are you observing before it becomes common?
Step 3: Score and decide
Three Yes answers means gold. Double investment. Build compounding advantages. These are the 1-2 datasets worth 10x the investment of everything else.
Two Yes answers means good. Maintain investment. Monitor for degradation. These create real advantages but are more fragile than Gold tier. One dimension failing means the advantage could evaporate quickly.
One Yes answer means “nope!” Deprioritize unless path to strengthening is clear. You might have exclusive population access but the behavior is universal, or unique behavior but no temporal advantage. Marginal advantages rarely compound into moats.
Zero Yes answers means “nope!” Kill investment. Reallocate resources. This is the most important category because most “proprietary data” falls here. You’re spending money building infrastructure to observe behaviors competitors can equally see.
Step 4: For 2-3 “yes” datasets, build your observation advantage
Document specific behaviors only you can see. Identify insights competitors cannot replicate. Throw a ton of AI at it! Build product improvements from unique observations. Track your temporal window—when will this advantage erode? Use the exclusive observation period to build features, operations, or strategies competitors can’t copy even after they reach similar scale.
Most “proprietary data” strategies won’t survive this audit. That’s the point. You’re hunting for the 1-2 datasets that pass 2+ dimensions. Those are worth 10x the investment of commodity data infrastructure.