
The 90-minute data strategy workshop that separates winners from dashboarders
There are only two types of companies: those who know what a data strategy is and those who really do.


When I tell business leaders "data strategy is business strategy," I get one of two reactions:
Type 1: Immediate recognition. They nod knowingly. They understand that data isn't about dashboards—it's about competitive advantage.
Type 2: Immediate recognition. Then they start talking about their BI tools, analytics team, KPI dashboards. They think measuring equals strategy. They don't have a data strategy—they have an expensive reporting system.
Here's the uncomfortable truth: 90% of companies are in Type 2, spending millions on analytics that create zero competitive advantage. The 10% who get it right use a systematic process to identify where data creates moats competitors can't cross.
If you only have 5 minutes: here are the key points
Most companies confuse data reporting with data strategy—90% fall into this trap.
A 90-minute workshop, focused on mapping your value chain and identifying high-friction customer transitions, can uncover real data leverage.
Start by mapping how your business actually creates value, not how you wish it did.
Focus on customer friction, not internal effort, to rate each transition in your value chain.
Use existing data first to reduce friction, then identify what new data could transform problem areas.
Prioritize 2-3 high-impact opportunities, and resist the urge to tackle everything at once.
Real data strategy clarity emerges through action, not endless planning.
I'm going to show you exactly how to run that process. Warning: this isn't fun. It's hard work. But it's worth it.
The data strategy opportunity audit: 90 minutes to find your leverage point
This isn't theory. It's the exact workshop I run with leadership teams to identify their data leverage points. Will this solve your data strategy in 90 minutes? No. Will it identify where you should focus your next 6 months? Absolutely.
What you need:
Leadership team (2-6 people max)
Whiteboard or large paper
90 minutes uninterrupted
Someone to facilitate who isn't afraid to push back
Reality check upfront: Most teams will spend the first 30 minutes arguing about customer definitions. Plan accordingly.
Phase 1: Map your business value chain (25 minutes)
Step 1.1: Choose your perspective The 90% start with "what should we measure?" The 10% start with "how does our business actually work?" Use one of these tactics:
Tactic 1 - The Unaware Customer Journey: Start with someone who doesn't even know they have the problem your business solves. Follow them all the way to becoming a successful, renewing customer.
Tactic 2 - The Business Machine: Think of your company as a machine. What are your inputs? What transformations happen inside? What are your outputs? Map each transformation step.
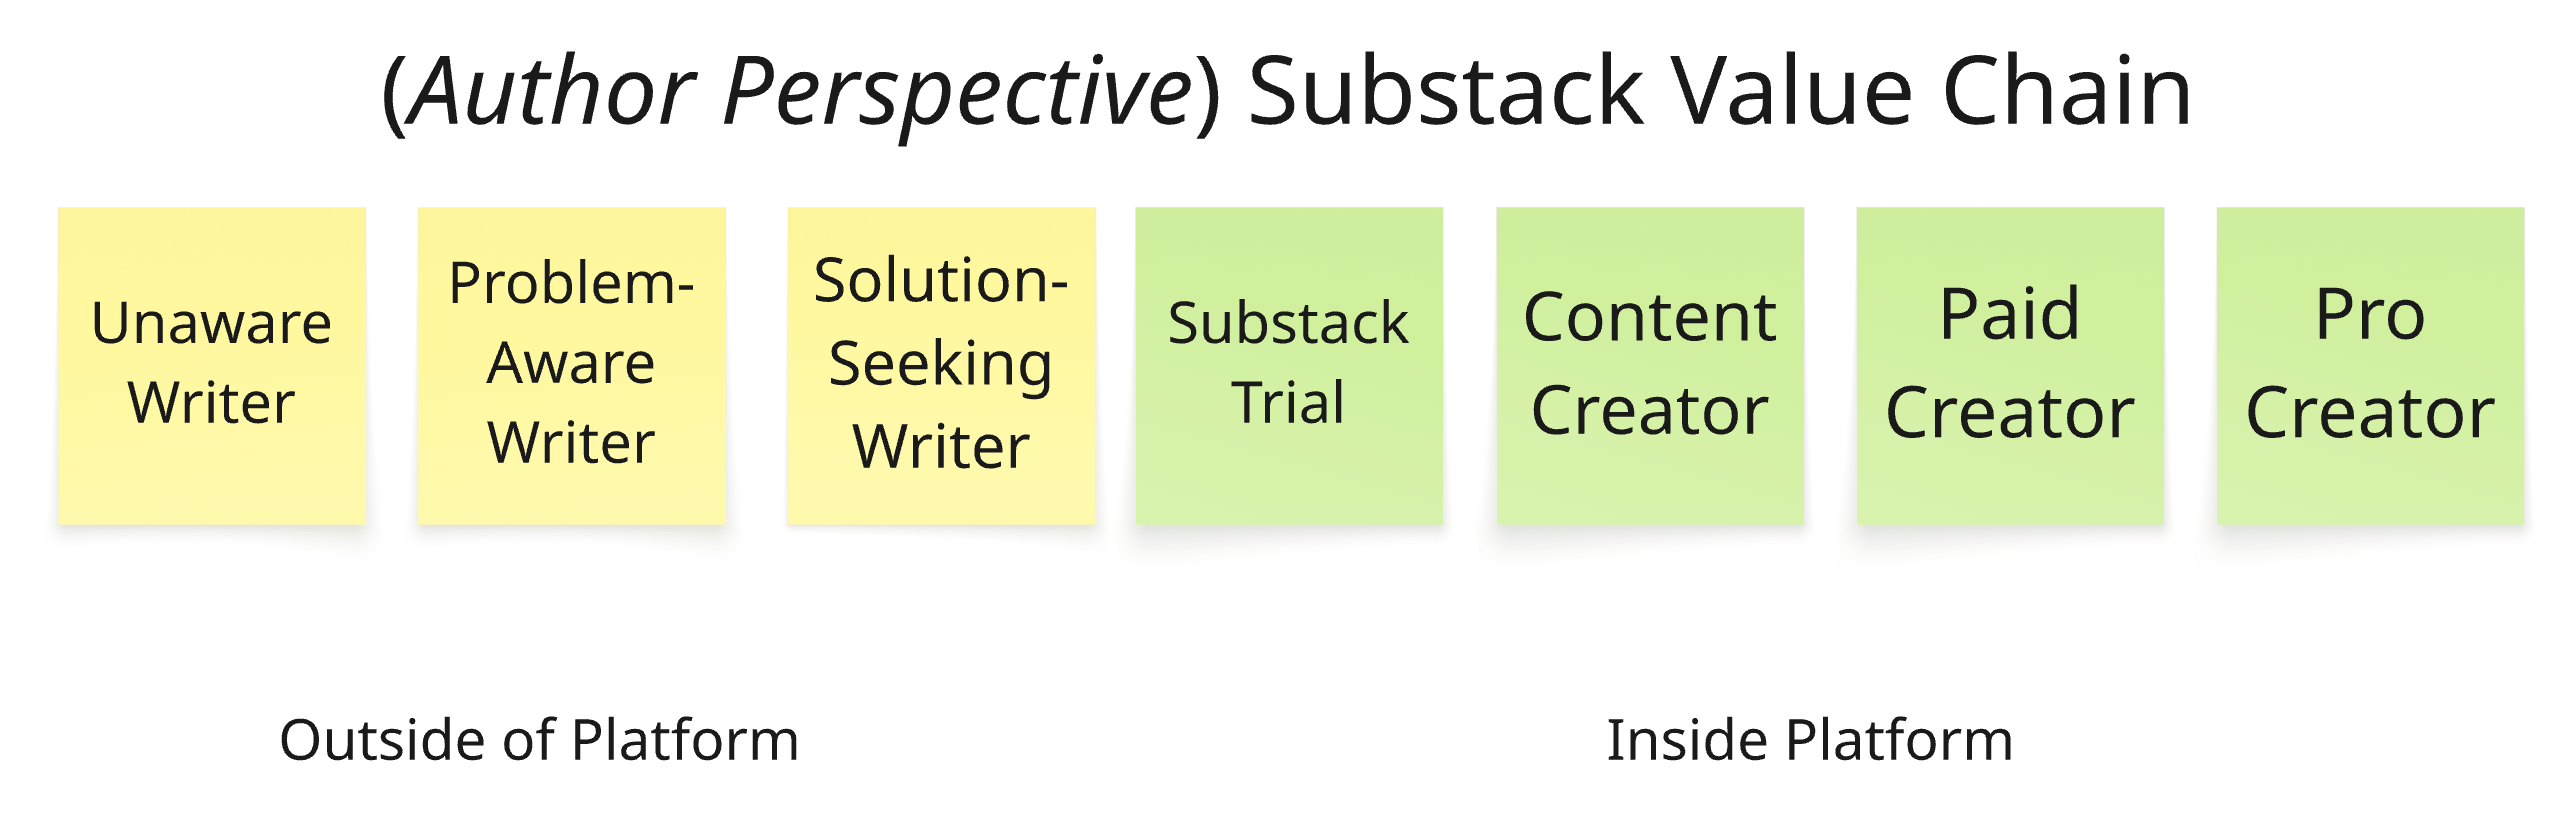
Let's use Substack as our example (based on public information and platform behavior). Using the unaware customer tactic:
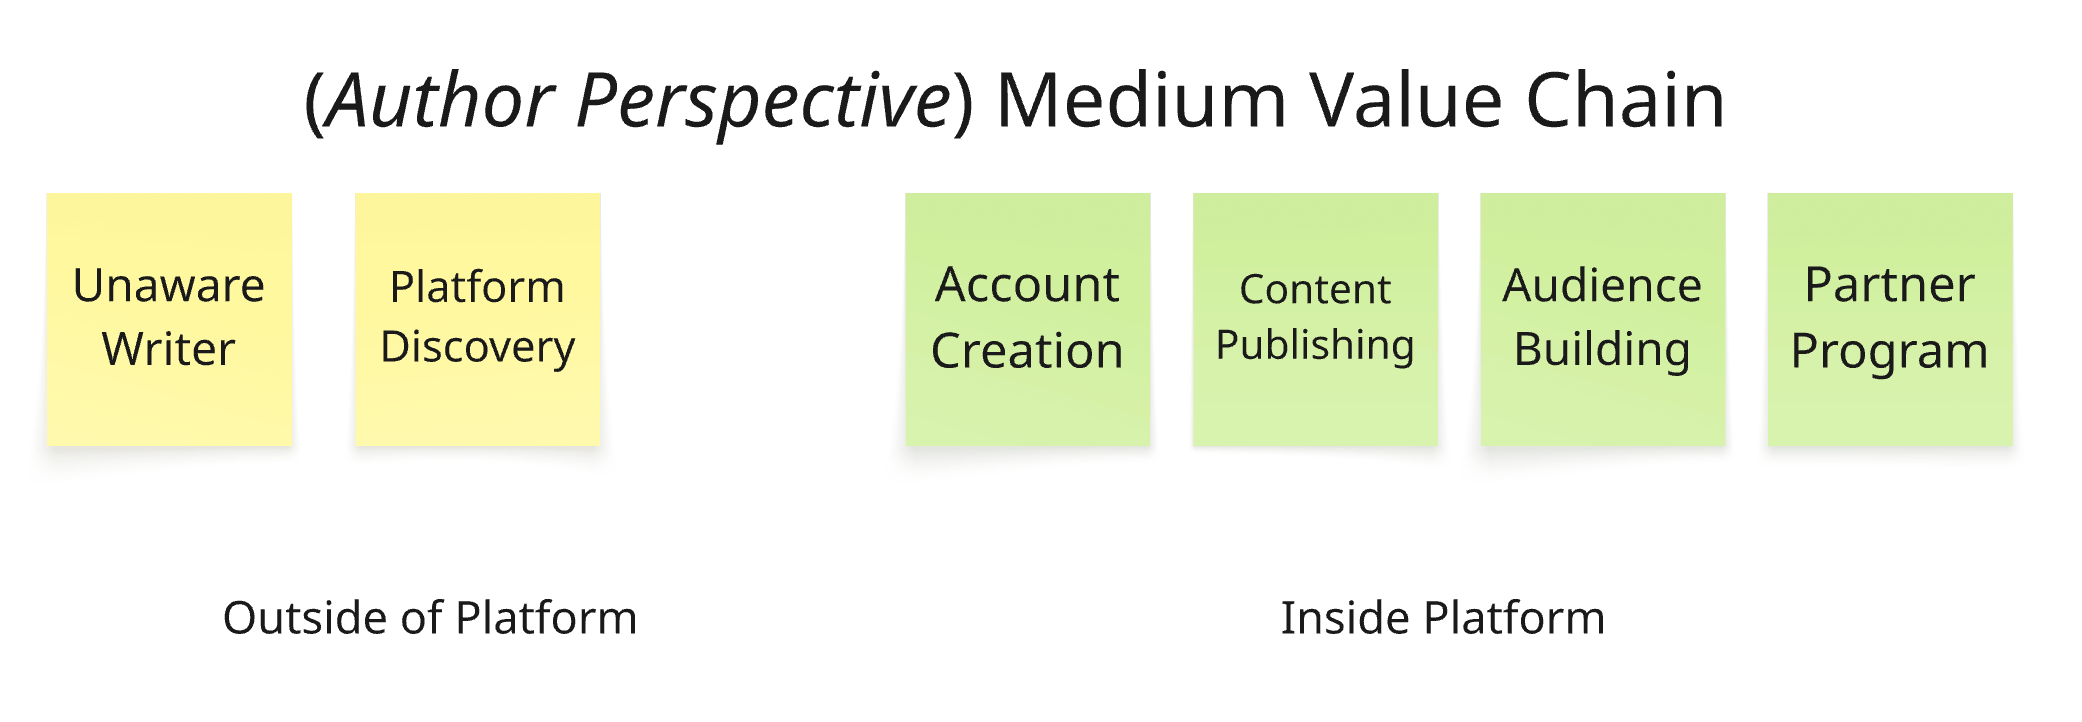
Step 1.2: Map your top 2 competitors' value chains Pick your two biggest competitors and map their customer journey. Be brutal about where they might be stronger.
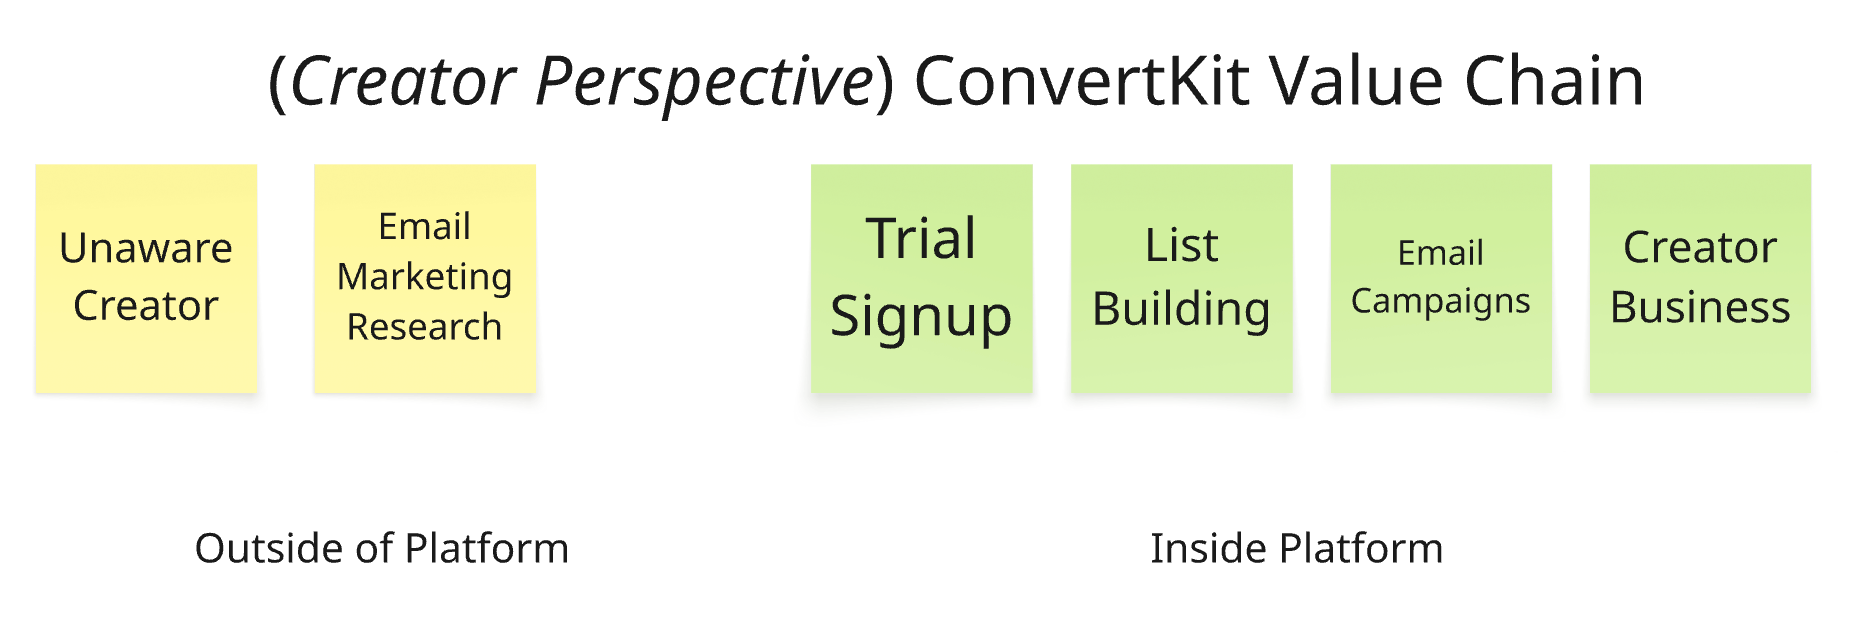
For Substack, let's map Medium and ConvertKit:
And one for ConvertKit:
How teams screw this up: (1) They map their ideal customer journey instead of their actual one. Force the team to be honest about where customers actually struggle or bail out. (2) They don’t realize that there’s lots of perspective and ways to look at the value chain! Substack is basically a two-sided platform, meaning there are two perspectives to consider here really. Just pick one, and go with it, and later do a second one. (3) They pick a different perspective for the competition! We’ve picked the same journey, from unaware content creator/writer (subset!) to some paid business outcome for that person.
Step 1.3: List ALL your transitions For each step in your value chain, identify the transition with a clear name: [State Before] → [State After] = Transition Name
Substack's transitions:
Problem Discovery: Unaware Writer → Problem-Aware Writer
Solution Research: Problem-Aware Writer → Solution-Seeking Writer
Platform Onboarding: Solution-Seeking Writer → Substack Trial
Content Activation: Substack Trial → Content Creator
Audience Building: Content Creator → Engaged Creator
Monetization: Engaged Creator → Paid Creator
Scale Growth: Paid Creator → Pro Creator
Phase 2: Rate customer friction (20 minutes)
Step 2.1: Apply the friction test For each transition, rate customer friction 0-10 using these two questions:
Question 1: "How much uncertainty, waiting time, or effort does the customer experience in this transition?"
Question 2: "How often do customers get stuck or give up during this transition?"
How do you do that? Well of course by looking at your competition! After all you already mapped them out!
How teams screw this up: They rate friction based on how hard the transition is for the company to deliver, not how hard it is for customers to experience. Force them to think from the customer's perspective.
Substack's transitions (estimated based on typical creator platform challenges):
Problem Discovery: 8/10 (writers don't know they need a platform)
Solution Research: 6/10 (many newsletter platforms exist)
Platform Onboarding: 3/10 (Substack made this smooth)
Content Activation: 7/10 (blank page syndrome)
Audience Building: 9/10 (hardest part for most creators)
Monetization: 5/10 (Substack simplified payments)
Scale Growth: 8/10 (hitting paid subscriber growth walls)
Phase 3: Identify data opportunities (25 minutes)
Next question: "Where can data eliminate friction?" Don’t ignore your competition, another look at their comparable steps, their transitions, where do they already use data? Where do they not but you could?
Step 3.1: Existing data leverage For each high-friction transition ask: "How could we use data we already have to reduce this friction?"
Substack examples:
Audience Building (9/10 friction):
Existing data: There is a reason why Substack invests so heavily into audience “tools,” like their own network, recommendation tools, “notes” and so much more. Existing data includes what authors write, and what readers read, activity logs basically. Both can be leveraged into matching the two sets better, and thus, from the writers perspective, to build audiences.
Scale Growth (8/10 friction):
Existing data: Substack tracks 30-day views, open rates, paid subscribers, and gross annualized revenue. All of this data could be leveraged into helping writers to identify the tactics that work best to grow their audience (at the moment I’m not aware that Substack offers anything in that direction - in fact I had to build my own extension to get reasonable tracking at all).
How teams screw this up: (1) They immediately jump to collecting new data instead of leveraging what they already have. Start with existing data first.
Step 3.2: New data opportunities For the same high-friction transitions, ask: "What new data could we collect to make this transition frictionless?"
Substack examples:
Problem Discovery (8/10 friction):
New data needed: Track writers on Twitter/LinkedIn who consistently get high engagement but struggle with monetization
Opportunity: Proactively reach writers when they hit monetization walls elsewhere
Content Activation (7/10 friction):
New data needed: Monitor successful writers' content creation workflows and reader engagement patterns
Opportunity: AI writing assistant that suggests topics based on what's working across similar creators in their niche
Audience Building (9/10 friction):
New data needed: To build audiences from a blank plate, Substack cannot use the existing data on the writers side. It would have to use new data sources; Like hot trending topics on the internet, it could pull in other sources and ask the writer for a writing sample to better help the writer create new content.
How teams screw this up: (1) Have seen this too often, companies love to ignore the fact that they could get new data either by building tech, by research or by buying data. Data is always an investment.
Phase 4: Reality check and selection (20 minutes)
This is where most teams want to solve everything at once. Resist that urge.
Step 4.1: Identify your top candidates Look at your high-friction transitions and pick the 2-3 that seem most promising. Don't force yourself to choose just one—you need options to evaluate properly.
For Substack, the top candidates would likely be "Audience Building," "Problem Discovery," and "Scale Growth"—all high friction, all potentially addressable with data.
Step 4.2: The reality test For each candidate, honestly assess:
Do we have the data capabilities to tackle this?
Would success here actually matter to our business?
Can we measure progress without building a whole new analytics stack?
If you can't answer these questions in the room, that's fine. That's what the next few weeks are for.
The commitment
You should leave this workshop with a complete value chain mapped against competitors, all transitions identified and named, friction scores for each transition, and 2-3 promising data opportunities to investigate further. Here's what most frameworks won't tell you: real commitment to a data strategy isn't something you decide in a conference room—it's something you discover through attempting the work.
You're probably not ready to commit 70% of your data budget to one transition, and that's okay. What you can commit to is the investigation. Pick one candidate from your list and spend the next week understanding it deeply. The 90% want certainty before they start. The 10% understand that in data strategy, clarity comes from doing the work, not planning it.